


Familygreenberg.com Health Check - January Edition
| Metric | December | January | % Change |
| Visits | 1,452 | 1,245 | -14.26% |
| Pageviews | 2,317 | 1,803 | -22.18% |
| Pages/Visit | 1.6 | 1.45 | -9.25% |
| Avg Time on Site | 0:47 | 0:49 | 4.69% |
| Bounce Rate | 79.68% | 81.77% | -2.62% |
| % New Visitors | 88.29% | 86.99% | -1.48% |
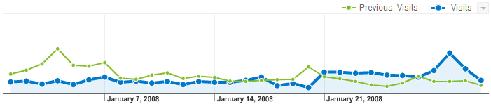
Two down months in a row. Clearly, I need to step up my game. In the "Behind Every Bad Report is a Good Excuse" category, I will note that I basically took the first two weeks of January off, as I was out of town with the family during that time. In fact, if you look at the daily graph (below) of visits per day, you'll see that December (in green) had January (in blue) beat consistently for the first two weeks, then it became a horserace, and then January took over the lead.
Lesson learned: To paraphrase Dory the Fish: Just keep blogging, just keep blogging...
posted by Brian at
12:34 PM
![]()
0 Comments:
Post a Comment
<< Home